Executive Context
A global beauty conglomerate operating in the SA-MENA region faced chronic inventory misalignment. The organization required a 1.5-year forecast horizon to manage a high-churn assortment of cosmetic SKUs. Despite four previous attempts by external vendors, forecast accuracy remained below 60%, leading to a dual crisis: excessive inventory holding costs and deep margin erosion from clearance discounting.
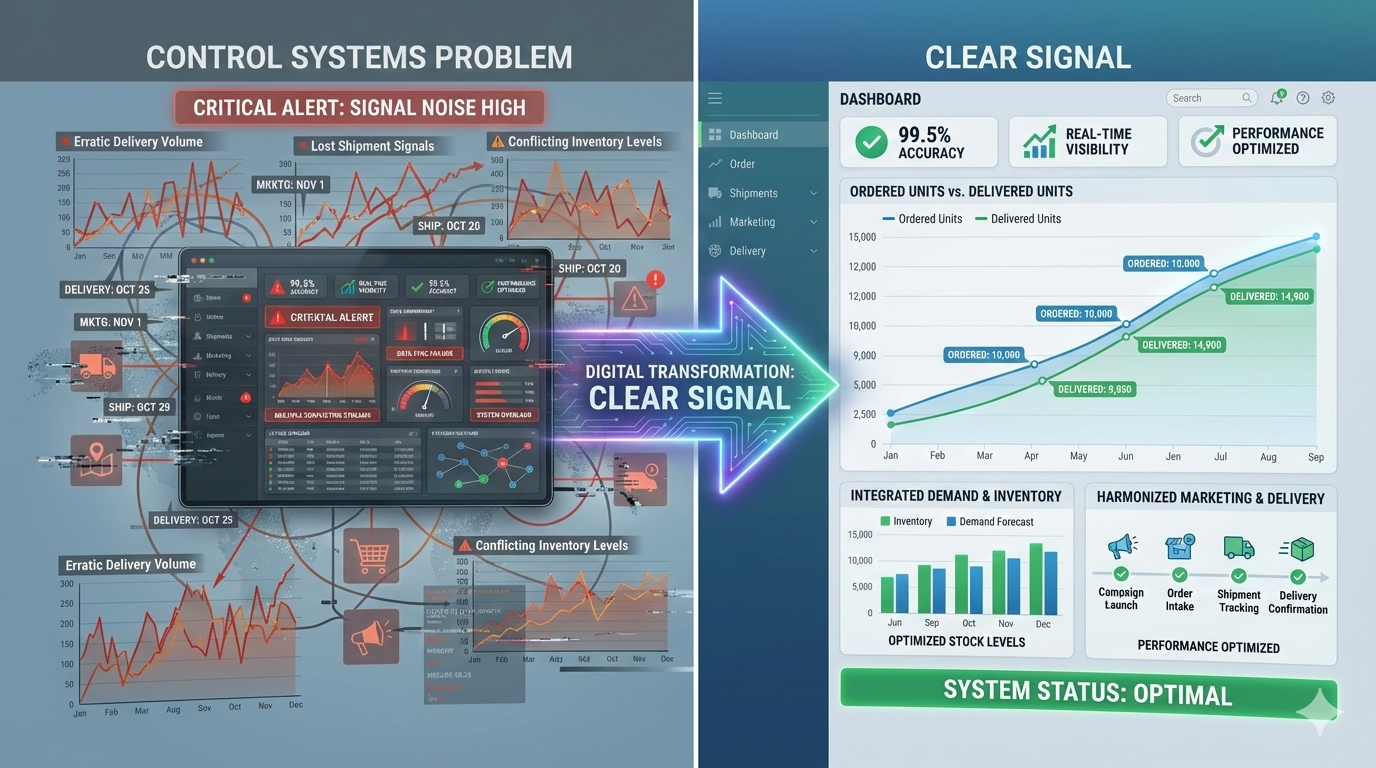
The operational constraint was latency. The supply chain was reacting to “Delivered Units” data, which included 3–10 days of logistical noise (returns, shipping delays), rather than the pure demand signal.
The Actual Problem
While the stated problem was “Forecast Accuracy,” the underlying economic issue was Signal Contamination.
The organization was attempting to solve a Control Systems problem (lag) with a Regression tool. Previous models failed because they trained on “Delivery Date”—a lagging indicator polluted by operational friction. This created a mathematically inevitable phase shift: the business was forecasting based on what happened 10 days ago, not what the customer intended today.
This misalignment forced the organization to stockpile inventory as a buffer against their own blindness.
Diagnostic Approach
We paused the modeling phase to audit the signal chain.
- Data Sufficiency: The raw data existed but was temporally misaligned. Marketing spend (Weekly) and Sales (Daily) were out of sync, creating noise.
- Methodological Fit: Standard time-series models were failing because they treated “Delivery” as the truth. We identified “Order Date” as the only valid independent variable for customer intent.
- Infrastructure Readiness: The client lacked a unification layer to view “Marketing Promises” and “Inventory Reality” simultaneously.
Strategic Intervention
The intervention reframed the challenge from “Predicting Sales” to “Modeling Intent.”
1. Reverse-Engineering the Signal
We shifted the entire forecasting architecture from “Delivered Units” to “Ordered Units.” By removing the logistical lag (5–10 days), we isolated the pure correlation between Marketing Spend and Customer Action.
2. The Granularity Sync Engine
We engineered a pre-processing layer that aligned disparate data streams—Marketing Spend, Campaign Intensity, and Sales—into a unified temporal granularity. This allowed the model to weight “Campaign Intensity” not just by spend, but by qualitative impact.
3. Inventory-Demand Coupling
We deployed a “Price Point” optimization engine. Instead of a static forecast, the system output dynamic discount recommendations required to clear specific assortments based on the new, accurate demand curve.
Outcome & Attribution
Decoupling the signal from the noise produced a sharp correction in the P&L.
| Metric | Pre-Intervention | Post-Intervention | Impact |
|---|---|---|---|
| Inventory Savings | N/A | $23 Million | Reduced overstocking |
| Margin Expansion | N/A | $12 Million | Optimized discount depth |
| Forecast Accuracy | <60% | 95% | Surpassed 80% target |
| Planning Cycle | 7 Days | 2 Days | 60%+ velocity gain |
Strategic Takeaway for Executives
Latency is the invisible killer of forecast accuracy. In this case, success came not from a “smarter” AI model, but from the engineering decision to treat Order Date as the signal and Delivery Date as noise.
For enterprise leaders: If your data inputs have a lag, your strategic decisions will always be reactive.
Open for confidential dialogue regarding inventory optimization and demand signaling.