AI in Automotive Quality Control: How ECG-Style Anomaly Detection found Faulty Engines in <5 Secs
A case of AI in automotive quality control where ECG-style anomaly detection caught 20 faulty engines hidden in 1.3M units, in under 5 seconds each, by defining normal instead of chasing rare faults.
What is ESA? : Engine Signature Analysis(ESA) is a hard automotive quality-control problem where you detect whether an engine is likely to stay healthy by comparing its cold-test behaviour against normal engine behaviour, instead of relying only on rare fault examples or expensive hot testing.
What Is Engine Signature Analysis?
Engine Signature Analysis means reading the reliability curves of an engine and asking a simple question: does this engine behave like a normal healthy engine, or is it deviating in a way that can become a long-term problem?
In this case, the goal was not just to catch a visible fault. The goal was to understand whether an engine was healthy enough without firing it through full hot testing. That is where the problem becomes interesting, because now you are not only looking for a known defect. You are looking for abnormal behaviour before it becomes a bigger downstream issue.
The Problem: 20 Faulty Engines Out of 1.3 Million
Once, I was working with an automotive company that wanted a faulty engine caught in under 5 seconds, on a testing bed, live on the production line. Sounds doable, till we came to know we had only 20 faulty examples out of 1.3 million units.
That was the RFP. This automotive company wanted something called Engine Signature Analysis: it basically takes the reliability curves they observe on the engine, and uses them to detect a faulty one.
Why Faulty Engine Detection Matters in Automotive Quality Control
Though the number of detected faults looked small, this programme was not small at all. These guys produce 100,000 units a month, and they supply to multiple vendors. If anything goes wrong at their end, it becomes a big downstream problem.
And the best, or worst, part is that these are cold reliability curves, taken at first-assembly inspection. So there is no hot testing. The engines are not fired before assembly. You don’t put the fuel in and let it burn at various throttles. You run it cold, just on the lubricant, to see if the engine is in a shippable state or not. In practice, only 5% of the lot gets hot testing, and it catches a fault only 20% of the time. The rest only surface when the vehicle is already in the field, and someone brings it back to the service center.
Now you might wonder: if the hit rate is so low, then why do it at all? Because the cost of getting an engine wrong is big. First, their downstream vendors might raise a claim. Second, many people don’t even know they have the issue. They get it fixed and keep running the car with their family in it, and it may cause harm to life. But there is no way to tell it a priori.
Why Fault Prediction Did Not Work
Coming back to the problem at hand. When we won the RFP, we started with hardly 20 samples of faulty engines out of 1,300,000 units. And for only 10 or 12 of those did we even know why they were faulty. For the rest, you can surface the structural issue, but you can’t exactly name it.
Now, when we went on-site, the floor engineers told me one peculiar thing. The way they were thinking about these curves was that the system is trying to predict something that has gone beyond a normal level or range.
And that statement stayed with me. It was the first clue to how such unnamed issues could be highlighted.
The Shift: Stop Predicting Faults, Define Normal
During those days, I was getting my annual medical checkup done. And because we’re humans, when we look at our blood report, we’re always looking at the outliers, what’s deviating from the normal range. That’s out of range, so that’s probably our issue, and doctors mostly prescribe on top of that, reading from the report.
So in a nutshell, it gave me an idea. If I could define a normal engine, and I have too many samples of a normal engine, I could probably just test how deviated a particular engine is from it. It could be a point or a range of outliers, or an abnormal pattern altogether.
This is the part I think many AI teams miss. The problem was not asking us to predict every possible fault. The problem was asking us to understand whether a particular engine had moved away from healthy behaviour.
Why Normal Beats Prediction When Fault Data Is Rare
Most people look at a problem like this and ask: can we predict the fault?
But that was the wrong lens here. When you have only 20 faulty examples out of 1.3 million units, and half of those faults are not even clearly named, prediction becomes weak. You don’t have enough labelled fault history to teach the model what every failure looks like.
So the better question was: can we define what normal looks like?
Because if normal is well understood, abnormal starts showing itself. Some business problems need prediction. Some need optimisation. Some need anomaly detection. And some need no AI at all. If you force every problem through the same lens, you don’t get intelligence. You get a science fair project.
How an ECG Report Inspired the Engine Anomaly Detection Method
Till this time we weren’t looking at algorithms yet. But when we started, a big catch came up. We needed to detect a faulty one in sub-5-second time, within the tiny space of an ECU (< 500 MB RAM). We tried many classical ML algorithms, but when I looked around, I wasn’t able to find one that fit that speed, that memory footprint, and that kind of behavioural detection. Simply, I couldn’t find one.
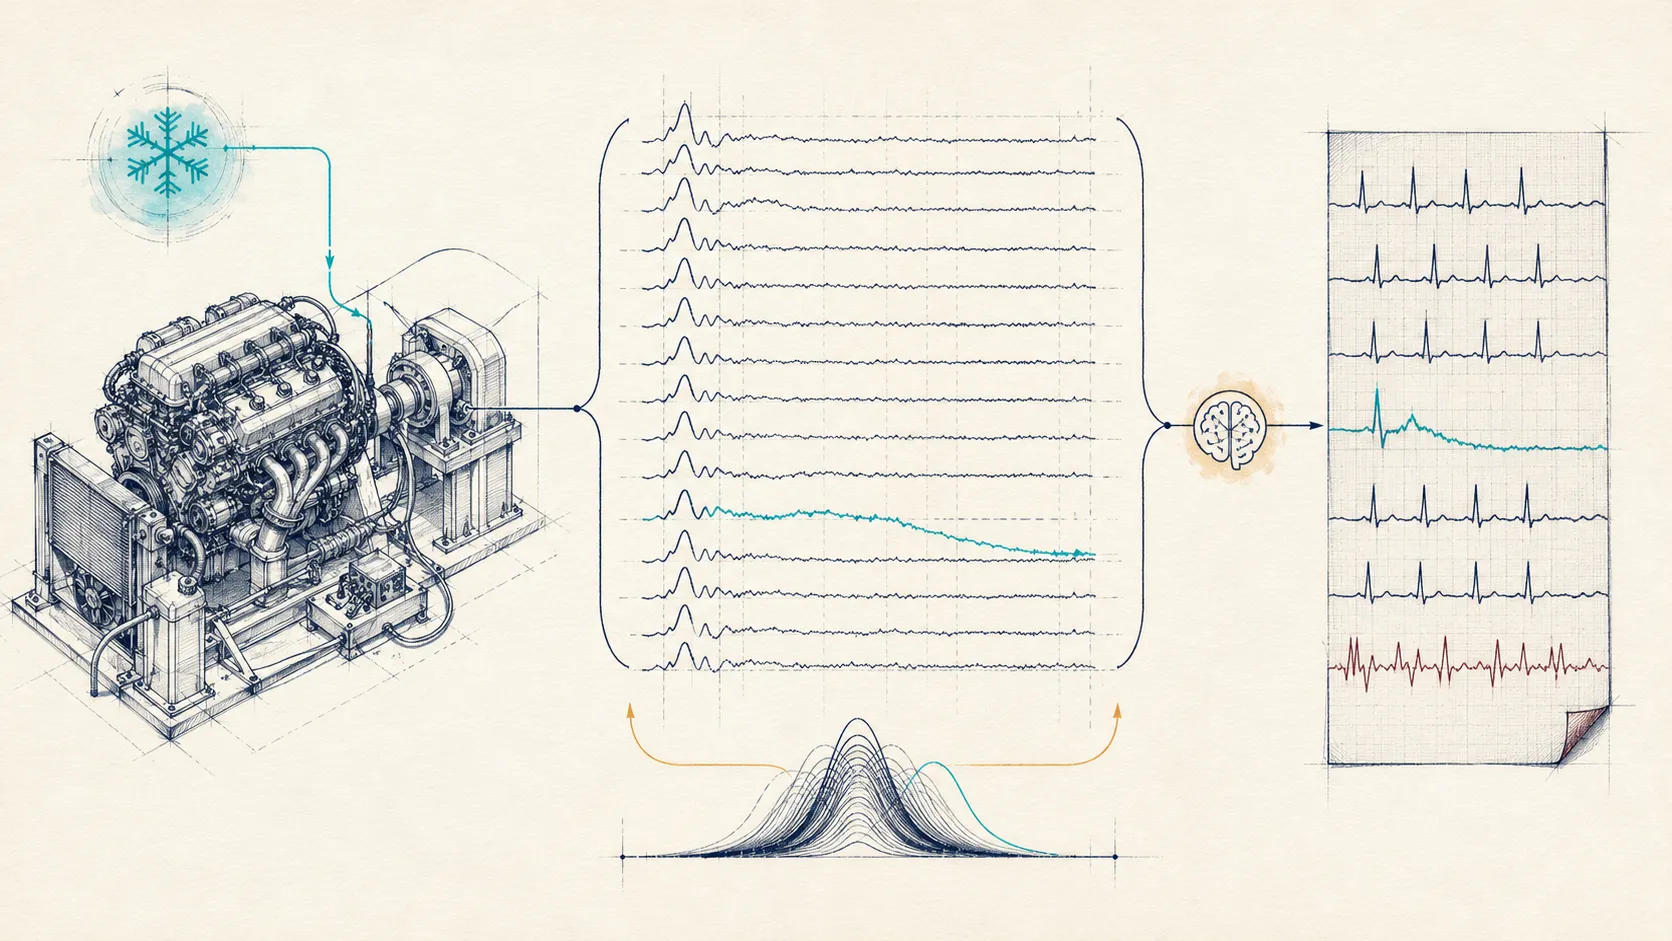
While my search was on, the final ECG report came in for me. And that’s where it hit me. An ECG takes all the known healthy samples and tells you this one isn’t standard, and which heartbeat pattern is deviating. It was behaving in exactly the same structure we wanted to detect, and it is embedded in a machine that is pretty small and has very little space. The constraints were exactly like how our system needed to be built.
I later found out Ted Dunning builds the whole method off a heart signal, so the leap wasn’t luck. That’s where I learnt about t-digest, which is built around deviations. And then we built a system on top of the methods we learnt from the ECG.
That is why I call the ECG connection an affine analogy, not a decorative one. It was not just a story to make the post interesting. It gave us the structure of the solution.
Scaling the Method Across 250,000 Signals Per Engine
Initially we thought we had a solution in one shot, but another problem was waiting to be solved. We had 43 variables across 4 observations per engine, with 1,440 rows per variable. So the total number of observations we needed to process was 43 x 4 x 1,440, which is nearly 250,000, per engine, within five seconds, with no large RAM. That is a big number to process.
And then we had one more caveat. For humans, even the ECG has eight different kinds of observations, a bare minimum to test whether it is good or bad. Here, we had to scale it to many more observations. But the problem is: in humans, even if one signal is faulty, we flag it as a problem. Here we can’t do that, because an engine has to be thoroughly bad before you call it insanely faulty.
So we had to add another layer of model on top, where we used a genetic-algorithm-style layer to bridge the final layer. That helped us get the speed and the efficiency at the same time.
 The full pipeline: define a normal engine from healthy history, score each engine's deviation with t-digest inside the ECU, surface which signal moved, and flag a fault only when enough signals agree — 250,000 observations per engine, under 5 seconds, under 500 MB. The leverage is a strong definition of normal, not rare-fault prediction.
 The full pipeline: define a normal engine from healthy history, score each engine's deviation with t-digest inside the ECU, surface which signal moved, and flag a fault only when enough signals agree — 250,000 observations per engine, under 5 seconds, under 500 MB. The leverage is a strong definition of normal, not rare-fault prediction.
The Result: Fault Detection in Minutes, Not Hours
When we finally built it, it was successful. And it doesn’t just say faulty or not. It tells you which signal is actually problematic.
For us, the proud moment was the reaction of the floor leads and engineers. They did not think this could be inferred that fast, with that kind of clarity. Earlier, they used to take around an hour to judge whether an engine was faulty and what the possible resolution could be. Now, with this model, they were able to make that judgement within 10 minutes of it being flagged as faulty.
What Actually Changed on the Shop Floor?
- Before: around 1 hour to judge whether an engine was faulty and what the possible resolution could be.
- After: judgement within 10 minutes of the engine being flagged.
- Constraint: sub-5-second detection inside an ECU with less than 500 MB RAM.
- Data reality: only 20 faulty examples out of 1.3 million units.
- Method shift: stop predicting rare faults directly; define normal behaviour and measure deviation.
The Lesson for AI Teams: Define Normal Before You Predict Faults
So in the end, the question was never “can you predict the fault?” You can’t predict what you can’t define. For us it was 20 units, and half of them were unexplained. But when you change the perspective to the question, “do you know what normal looks like, and how far is this one from it?”, you can find a solution.
This is why AI in business cannot be forced through one lens. Some problems need prediction, some need optimisation, some need anomaly detection, and some need no AI at all.
The ultimate job is not to apply the most hyped model, LLM, or agent blindly that is how AI projects fail but to understand the business problem deeply enough to ask the right technical question.
Want the right question asked of your business?
- Want it done with you a system that makes your AI actually move the P&L: AI Profit OS.
- Want to work it out yourself score and track your own AI opportunity: AI Profit Quotient.
- Not sure where it fits book a call and we’ll find the right lens together.
The Weekly AI Decision Brief
Strategy
The AI Confusion Tax: Why Companies Buy the Wrong AI
The AI Confusion Tax is the cost of choosing an AI tool before defining the business decision. See the vendor patterns, research signals, and scoping question that prevent it.

Strategy
AI Strategic Skills: Where Should a CEO Draw the Line?
The essential AI skills for executives — from spotting vendor hype to owning the delivery of business value. How to move from Tier 1 to Tier 3 leadership.

Strategy
Why Most AI Strategies Fail
And how to fix it — the 3 silent killers of AI projects: Pressure, FOMO, and Anxiety. How to diagnose your project before you waste another dollar.