Model Trees for Demand Forecasting With AI Agents
Model trees expose the rule and local equation behind a demand forecast, so an AI agent can test a bounded scenario for a planner.
Imagine a demand planner in a Monday morning stock meeting, staring at a forecasted demand spike for the upcoming holiday weekend.
Marketing was excited. “The deep learning model picked up the campaign signal,” they said. “We need to double the warehouse buy.”
The planner asked a simple question: “At what discount depth does this volume break? If we drop the promotion from 25% to 15%, how many units do we actually lose?”
Silence.
The model could generate a forecast number, but the number alone did not answer the planner’s question. The team would need to test changed inputs and check whether the resulting response was credible.
In this illustrative meeting, the team buys the stock anyway. The product sells, but shipping and fulfilment surcharges wipe out the margin.
This is the hidden failure mode of enterprise AI forecasting: a number without an explanation is not a decision.
When companies build AI agents on top of forecasters, the agent may receive a point prediction and offer a justification the model has not established.
To make an AI agent useful in supply chain planning, give it a way to inspect the forecast and test a bounded scenario. A model tree is one possible analytical engine underneath it.
How Do Model Trees Explain Demand Forecasts?
A model tree splits demand into operating regimes and gives each leaf a local linear equation an agent can inspect.
Imagine hiring an automated driver for a freight truck.
One truck has a sealed engine block welded shut. The dashboard only shows current speed: 58 mph. The driver cannot see the RPM, cannot check the gear ratio, and cannot see how much torque the engine produces on a steep incline. If you ask the driver whether the truck can carry an extra ton up the mountain, it can only guess.
The other truck has a glass gearbox. Every cog and ratio is visible. The driver can look down, see that the transmission is in third gear with a 3.2:1 torque ratio, and calculate exactly how much throttle is needed before the engine stalls.
SEALED BLACK BOX (Neural Nets / GBDTs) Input Features ──► [ 1,000 Hidden Weights ] ──► Point Prediction: 1,450 units (Agent cannot see the mechanical slope)
FLAT DECISION TREE (CART / Random Forest) IF Season = Q4 AND Region = East ──► Leaf Constant: 1,200 units (Zero continuous sensitivity; flat step output)
MODEL TREE (M5' / Cubist) IF Season = Q4 AND Region = East (Operating Regime) └──► Leaf Equation: Demand = 210 + 4.8*(Discount) - 0.3*(DaysToPayday) (Local associations visible to the agent)Standard trees (CART, Random Forests) turn data into rigid staircases. They split features until every leaf holds a single constant average. If your product price changes by two dollars, a standard tree either does nothing or jumps over an artificial cliff.
Ensembles and neural networks can be queried at changed inputs, but their response can be harder to inspect. Tools like SHAP attribute a prediction to features; that attribution does not tell you the causal price response for next week’s inventory buy.
A model tree (first introduced by Ross Quinlan as M5 and refined in the Cubist system) gives you both:
- The branches define operating regimes: Discrete, human-readable business contexts (e.g., clearance sales vs. regular season, weekend rush vs. weekday lull).
- The leaves provide local linear equations: Coefficients (
y = beta_0 + sum(beta_j * x_j)) show associations within that regime. They are not causal elasticities.
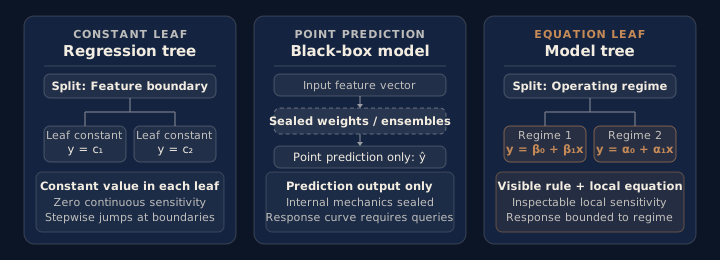 The useful difference is a visible rule and a local response, not a promise of better accuracy.
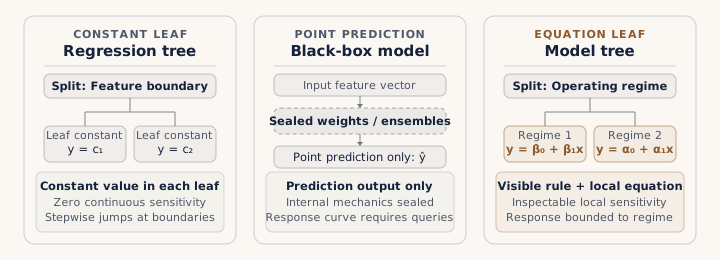 The useful difference is a visible rule and a local response, not a promise of better accuracy.
Scroll sideways to explore the full diagram.
I am building mltreelib, a Python package with a Rust core, to make these models easier to fit and inspect. It handles categorical values and missing entries, can fit linear leaves, and exposes splits and leaf coefficients. The repository shows the package. Whether it helps a planning decision must be measured on your data.
What Might Model Trees Show on Bike-Sharing Data?
The UCI Bike Sharing data offers operating regimes to test, but the rules and coefficients here are illustrative rather than fitted results.
The UCI Bike Sharing dataset is one place to test this idea. The regimes and coefficients below illustrate what an inspected model might expose; they are not results from a published fit.
Demand planning for transit and shared fleets can have different operating regimes: weekday commuting peaks, weekend leisure and adverse weather.
An illustrative model tree could express those regimes like this:
========================================================================ILLUSTRATIVE REGIMES & EQUATIONS (NOT A FIT TO UCI DATA)========================================================================
REGIME 1: Morning & Evening Commute Rush (Working Day = 1, Hour in 7..9, 17..19)  Conditions:    • Working Day = 1    • Hour in [7, 8, 9, 17, 18, 19]    • Weather Condition <= 2 (Clear or Overcast)  Leaf Linear Model:    Hourly Demand = -64.2 + 512.4*(Temperature) - 184.6*(Humidity) - 42.1*(Windspeed)  ----------------------------------------------------------------------  Mechanical Insight:    The coefficients would show local associations within this regime.
REGIME 2: Severe Adverse Weather (Rain / Snow / High Storm Severity)  Conditions:    • Weather Condition >= 3 (Light/Heavy Rain or Snow)  Leaf Linear Model:    Hourly Demand = 18.5 + 84.1*(Temperature) - 48.0*(Humidity)  ----------------------------------------------------------------------  Mechanical Insight:    A different leaf could have a different temperature coefficient.========================================================================
Notice what just happened.
The example pairs an operating boundary with a local equation. To claim those numbers for bike sharing, I would need the fit, feature units, time split and a baseline comparison.
How Can AI Agents Use Model Trees for Demand Forecasting?
An AI agent can inspect a model tree’s active rule and local coefficients to test a bounded forecast scenario.
Now, put an AI agent on top of this system.
In most companies today, AI workflows and agents are hooked up to predictive endpoints via REST APIs. The agent passes a JSON payload of features and receives a number back:
{ "sku": "COMMUTE-PASS", "forecast_demand": 435}The human asks: “Why is the forecast 435? What if temperatures drop 5 degrees tomorrow morning?”
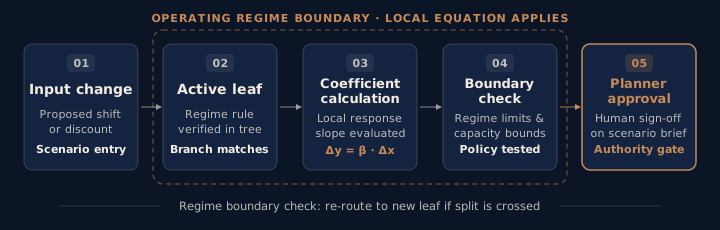 A local equation supports a scenario only while its operating regime still holds.
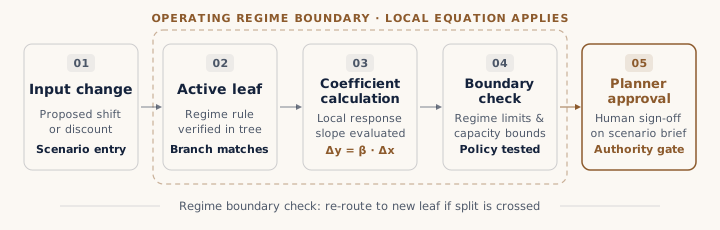 A local equation supports a scenario only while its operating regime still holds.
Scroll sideways to explore the full diagram.
The agent can query the API with changed values, but a point-only response makes the curve harder to inspect.
With a model tree, the agent could inspect a structural rule. This payload uses the illustrative coefficients above:
{ "active_regime": "Morning Commute Rush (Regime 1)", "intercept": -64.2, "coefficients": { "normalized_temp": 512.4, "humidity": -184.6, "windspeed": -42.1 }, "current_point_prediction": 435}Now the AI agent can calculate a bounded scenario. It still needs to check the feature units and re-route changed inputs if they cross a split:
- Calculate Local Sensitivity: The agent reads
beta_temp = 512.4per unit of normalised temperature. A 0.05-unit drop would change the leaf estimate by 25.6 rides per hour, if the input stays in this regime. A 5°C drop cannot be converted without the normalisation scale. - Evaluate Policy Constraints: It cross-references the adjusted demand against fleet battery charge levels and station dock capacities stored in the operational database.
- Draft the Commercial Plan: Instead of presenting an unverified number, the agent writes a structured operational brief:
“Tomorrow’s 8:00 AM rush hour appears to fall under the commute regime. The base forecast is 435 rides. If normalised temperature drops by 0.05 and the regime stays the same, this leaf estimates about 26 fewer rides. Check the weather units, dock capacity and service target before changing the shuttle plan.”
That is arithmetic over illustrative coefficients, not a verified dispatch recommendation.
How Could Model Trees Help Retail Promotion Planning?
A model tree could help a planner inspect local promotion response; the cited D2C engagement did not deploy one.
This is a proposed way to inspect a retail promotion forecast, not a claim that we deployed model trees in the following engagement.
In our promotion-aware D2C forecasting work for L’Oréal across five markets, the business faced a related planning problem.
The work covered 2,058 EANs and 8,044 size-level SKUs. The economic problem was promotion-aware planning.
Beauty products do not move in isolation. When you run a 20% discount on a premium serum, three things happen:
- Demand for that specific serum rises.
- It creates a halo effect, lifting demand for matching moisturizers in the same routine.
- It cannibalizes demand from mid-tier serums in neighboring lines.
Those cross-product interactions make promotion planning difficult. The case does not establish that a model tree was used to represent them.
If you test model trees here, possible regimes to inspect are:
- Baseline Organic Buying: Is the run rate steady without a promotion?
- Flash Sales & Payday Promotions: Does the local response change with discount depth, and are adjacent SKUs affected?
- New Product Launches: Is there enough history to estimate a useful response?
If the equations hold up on out-of-time data, an AI agent could sit between marketing and supply chain. It could check a proposed promotion against the active leaf, flag possible cannibalisation and lead-time constraints, then send the scenario to a planner. The coefficients alone do not identify the profit-maximising discount.
The procurement manager and commercial director remain in control. The model provides the math. The agent runs the scenario analysis. The human signs off on the purchase order.
What Should You Check Before Using Model Trees?
Check whether the decision needs counterfactual reasoning, whether the agent can audit the maths, and where a human must approve a change.
Before you commission another black-box forecasting pipeline or attach an LLM to an opaque prediction API, ask three questions:
- Does the decision require counterfactual reasoning?
If your planners need to ask “what if we change the price, the buffer, or the schedule?”, test changed inputs and ask whether local response is inspectable and valid. - Can your AI agent audit the math?
If an agent cannot inspect what drives a prediction, it may offer a justification the model does not support. - Where does the human check the boundary?
A model tree’s rules make regime shifts visible. You can see when a product moves from regular demand into promotion sensitivity, and you can place approval gates right at that transition.
Predictive accuracy matters. So does whether the model’s explanation survives a changed input and helps the planner make a better decision.
Do this week
- Ask your planners if the decision needs “what if” answers on price, buffer or schedule.
- Ask your team if any AI agent can show what drives a prediction.
- Mark where a human approves a change.
- Ask your analysts to test the model on out-of-time data before you trust it.
If you are untangling complex demand planning, promotion behavior, or inventory imbalances across fragmented channels, that is the work we do. Explore fractional CTO or chief AI officer advisory or read how we structured promotion-aware D2C forecasting.
Frequently asked questions
What is a model tree and how does it differ from a standard decision tree?
A standard regression tree outputs a constant at each leaf. A model tree can fit a local linear equation at each leaf. Its splits define operating regimes, and its coefficients show associations within each regime.
Why do black-box models fail when paired with autonomous AI agents in supply chain planning?
A point prediction alone does not show the response to a changed discount. GBDTs and neural networks can be queried again for scenarios, but their internal response is harder to inspect directly. SHAP attribution does not establish a causal price response.
How do model trees enable counterfactual reasoning for LLM agents?
An agent can read the active leaf equation and calculate an illustrative local scenario. It must re-route the changed inputs if they cross a split, and a planner must check margin, inventory and whether the estimated association is valid for the decision.
Were model trees used in the D2C forecasting case?
The D2C case used promotion-aware forecasting across five markets and 8,044 size-level SKUs. This article proposes model trees as a way to inspect local response; it does not claim they were deployed in that engagement.
Is this where your AI is leaking?
A 45-minute diagnostic shows where the logic between your data and your decisions breaks. No pitch, no deck.
Engineering
AI Anomaly Detection in Automotive Quality Control
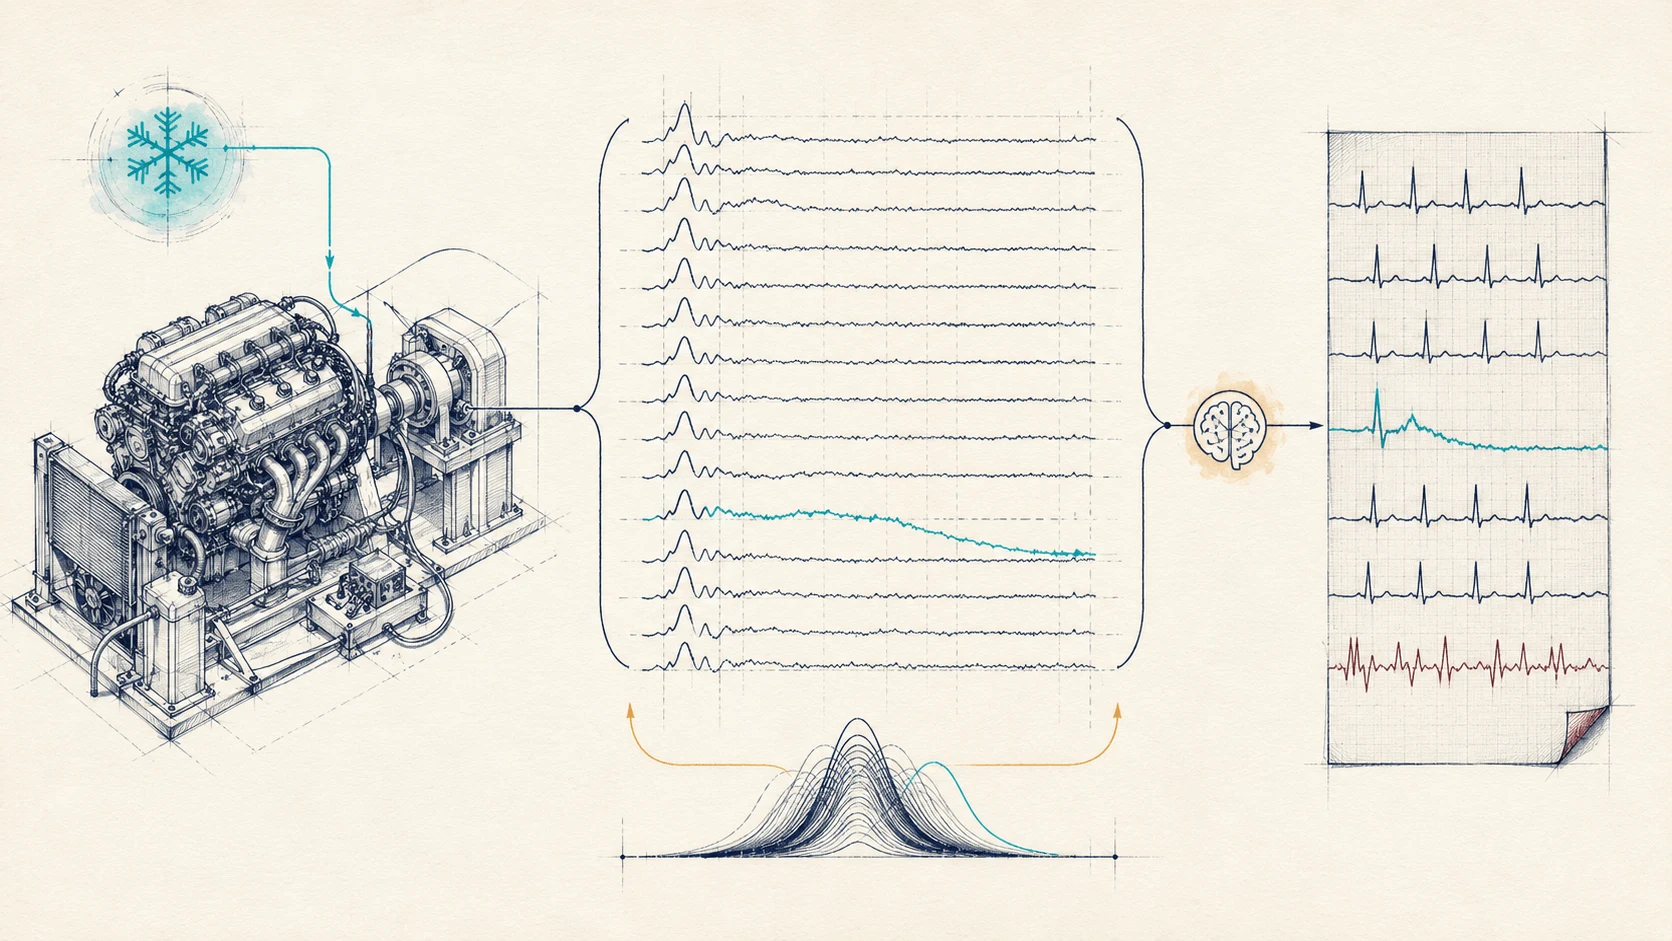
AI quality control with ECG-style anomaly detection: faulty engines flagged in under 5 seconds by defining normal, trained on 20 faulty examples from 1.3M units.

Engineering
TrieKNN: Unleashing KNN's Power on Mixed Data Types
TrieKNN extends K-Nearest Neighbors to datasets that mix categorical and numerical features. See how it works and where it fits.

Engineering
CrossTab Sparsity for Classification
Learn how to use the CrossTab Sparsity metric to pick the few variables that separate classes, then retrain a classifier on them.
The Weekly AI Decision Brief